
Use These 4 Vital Sections of Google Analytics to Understand Your Web Traffic
Do you relate to one of these scenarios?
1. I’m not receiving as much brand awareness, leads or sales from my website as preferred.
2. I have no idea why users are not filling out our request-a-quote form.
3. I’m going crazy over not being able to understand how visitors utilize my website.
If you answered yes to any of these three, it’s time to learn how you can measure your site's success by analyzing metrics.
Assuming you’re one smart cookie, you already have Google Analytics set up. If not, no worries. You have lots of room for improvement for your website. Click this link to setup your Google Analytics… NOW!
Once you're all set up, let's walk through the types of data Google Analytics provides, and how you can use it to your advantage to improve your site navigation and the type of content you’re providing to your users. Google Analytics is broken up into four main sections: Audience, Acquisition, Behavior and Conversions. Together, we’ll identify the questions that can be answered upon visiting each of these sections, the specific metrics that can be analyzed and a scenario you can relate with.
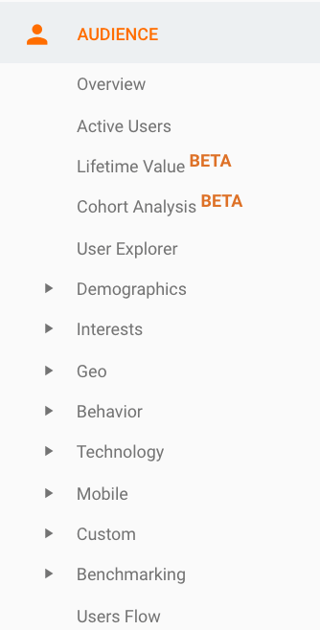
- Audience – Question: Who is visiting my website?
Metrics: Visitors demographics, geography, whether they are new vs. returning and the type of device they visited on.
Scenario: If your main target audience is "females under the age of 30 from the Midwest," you will look in this section to ensure you’re attracting the right users to the site. If you find something different (i.e. "males in their 60s from India"), you may want to reconsider the type of content you’re publishing.
- Acquisition – Question: How are users getting to my website?Metrics: Source and medium users are visiting the website from (i.e. source: Google, medium: paid search) and the engagement metrics related to each (i.e. average session duration, pages per session, bounce rate).
Scenario: If you are spending a pretty penny every month on a paid search campaign, but you find users visiting through these ads have a 98% bounce rate, you will want to reevaluate the keywords you’re bidding on and pay more attention to your quality score. 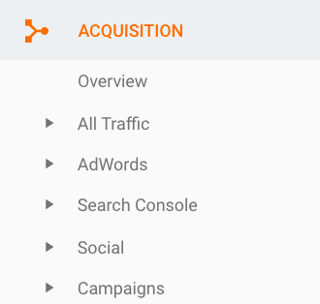
- Behavior - Question: What are users doing when visiting my website?
Metrics: Behavior flow chart of pages visited and pages exited, web pages viewed and tracked website events.
Scenario: If the main goal of your website is to educate your users about how your products can improve their lifestyle, you may be posting various blogs each month. The Behavior section will reveal which blog was most visited after your email blast last month and the amount of time they spend on the page. Upon setting up additional tracking, possibly through Google Tag Manager, metrics will be revealed in the events section. For example, PDF downloads.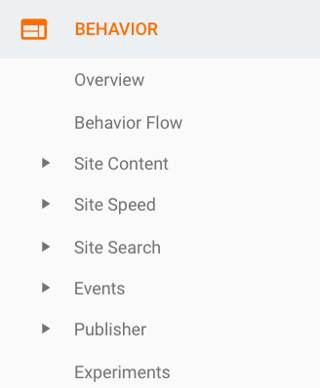
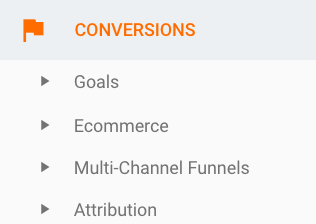
- Conversions - Question: Are users converting?
Metrics: Overview of the website goals, which traffic channels (i.e. Organic and Social) worked together to drive these goals, and a model comparison tool for attributing goal successes.
Scenario: If your site's goal is to drive leads, you’ll check the status of leads received within this Conversions section. If leads from the request-a-quote form decreased month-over-month, it’s worth investigating which marketing effort contributed to this decrease and why. Was there a shift in budget, a change in keyword targets, or was the quote page broken for half the month? Identifying what led to the decrease grants the opportunity to improve the amount of leads in upcoming months.
Overall, Google Analytics contains various metrics that can help tell the story of how visitors are utilizing your website. By analyzing this data, you can understand their journey and help improve their experience, leaving the user satisfied. Hopefully now, you can feel good about where to find and analyze these metrics within Google Analytics.
Go ahead, do a happy dance!
(To learn more about VI's SEO services, click here.)


